Zapier is a leading automation platform that connects apps and workflows, helping users save time and increase productivity.
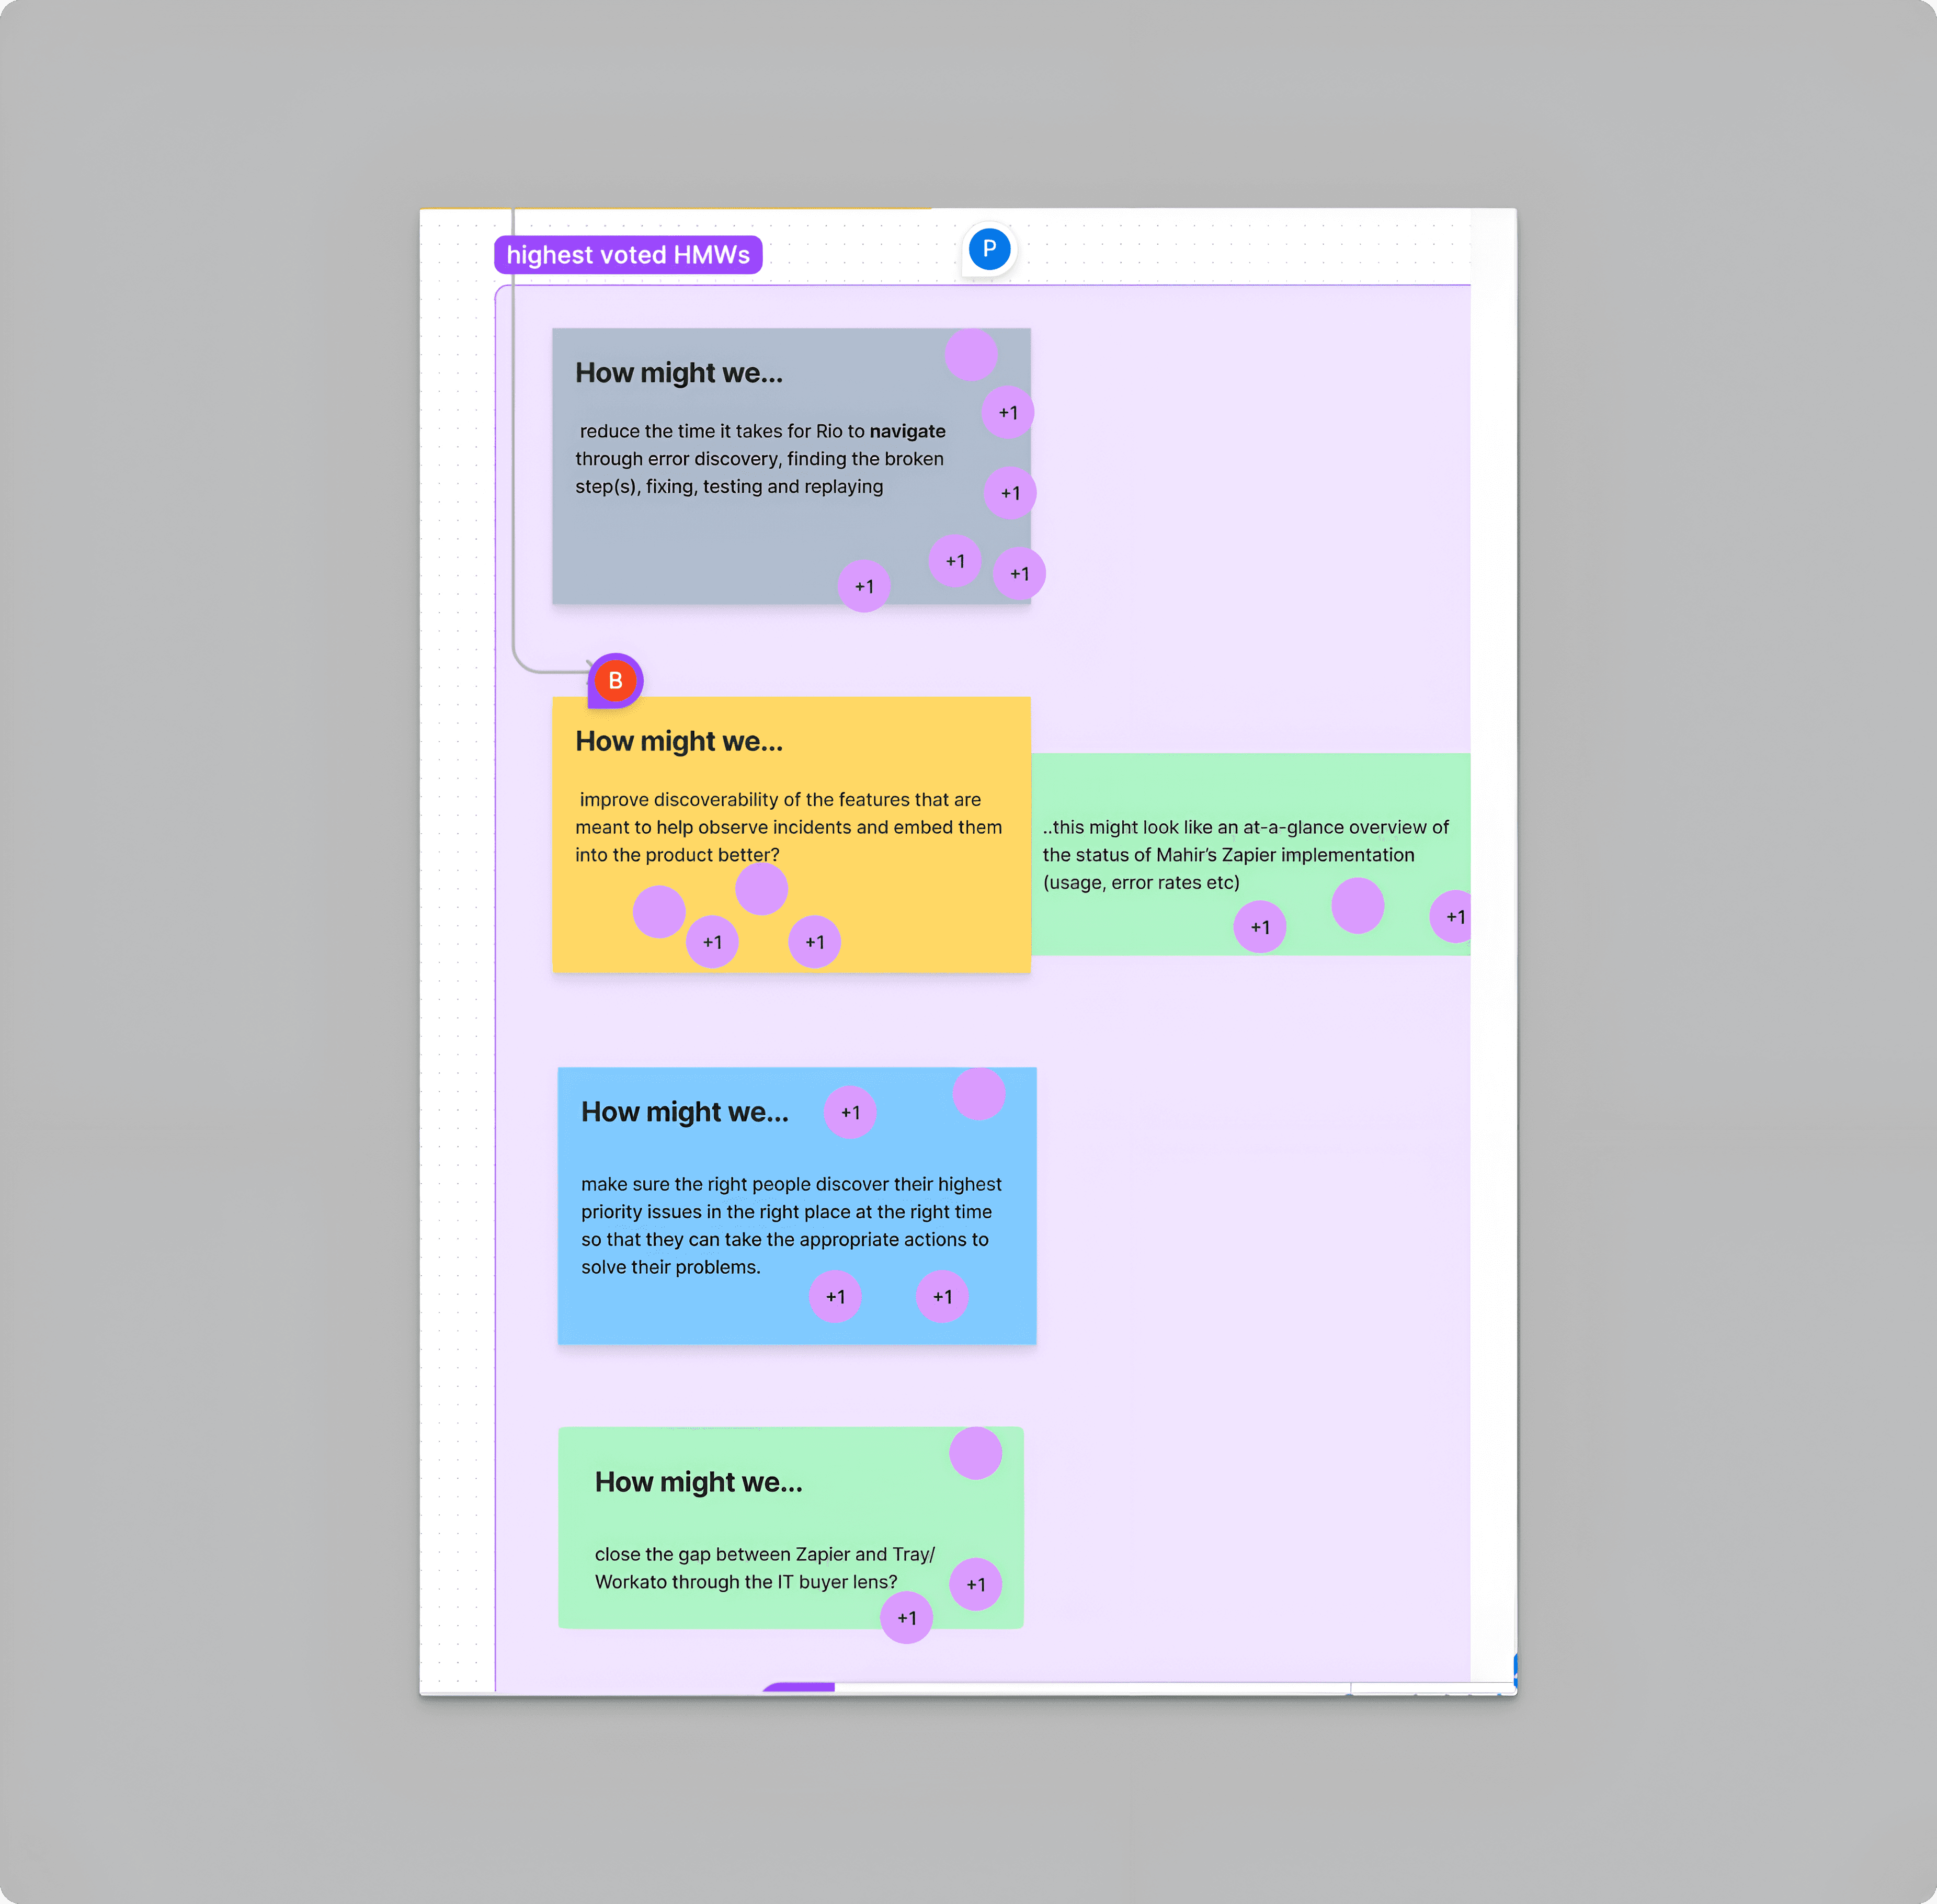
‘Analytics’ was a 0 -> 1 product release , a key offering of Zapier’s new enterprise package. Designed to provide users with actionable insights, it combines high-level KPIs, task usage analysis, and error tracking in a single centralized space. This effort represents a critical step in expanding Zapier's offerings for enterprise users.
Marketing video of Analytics
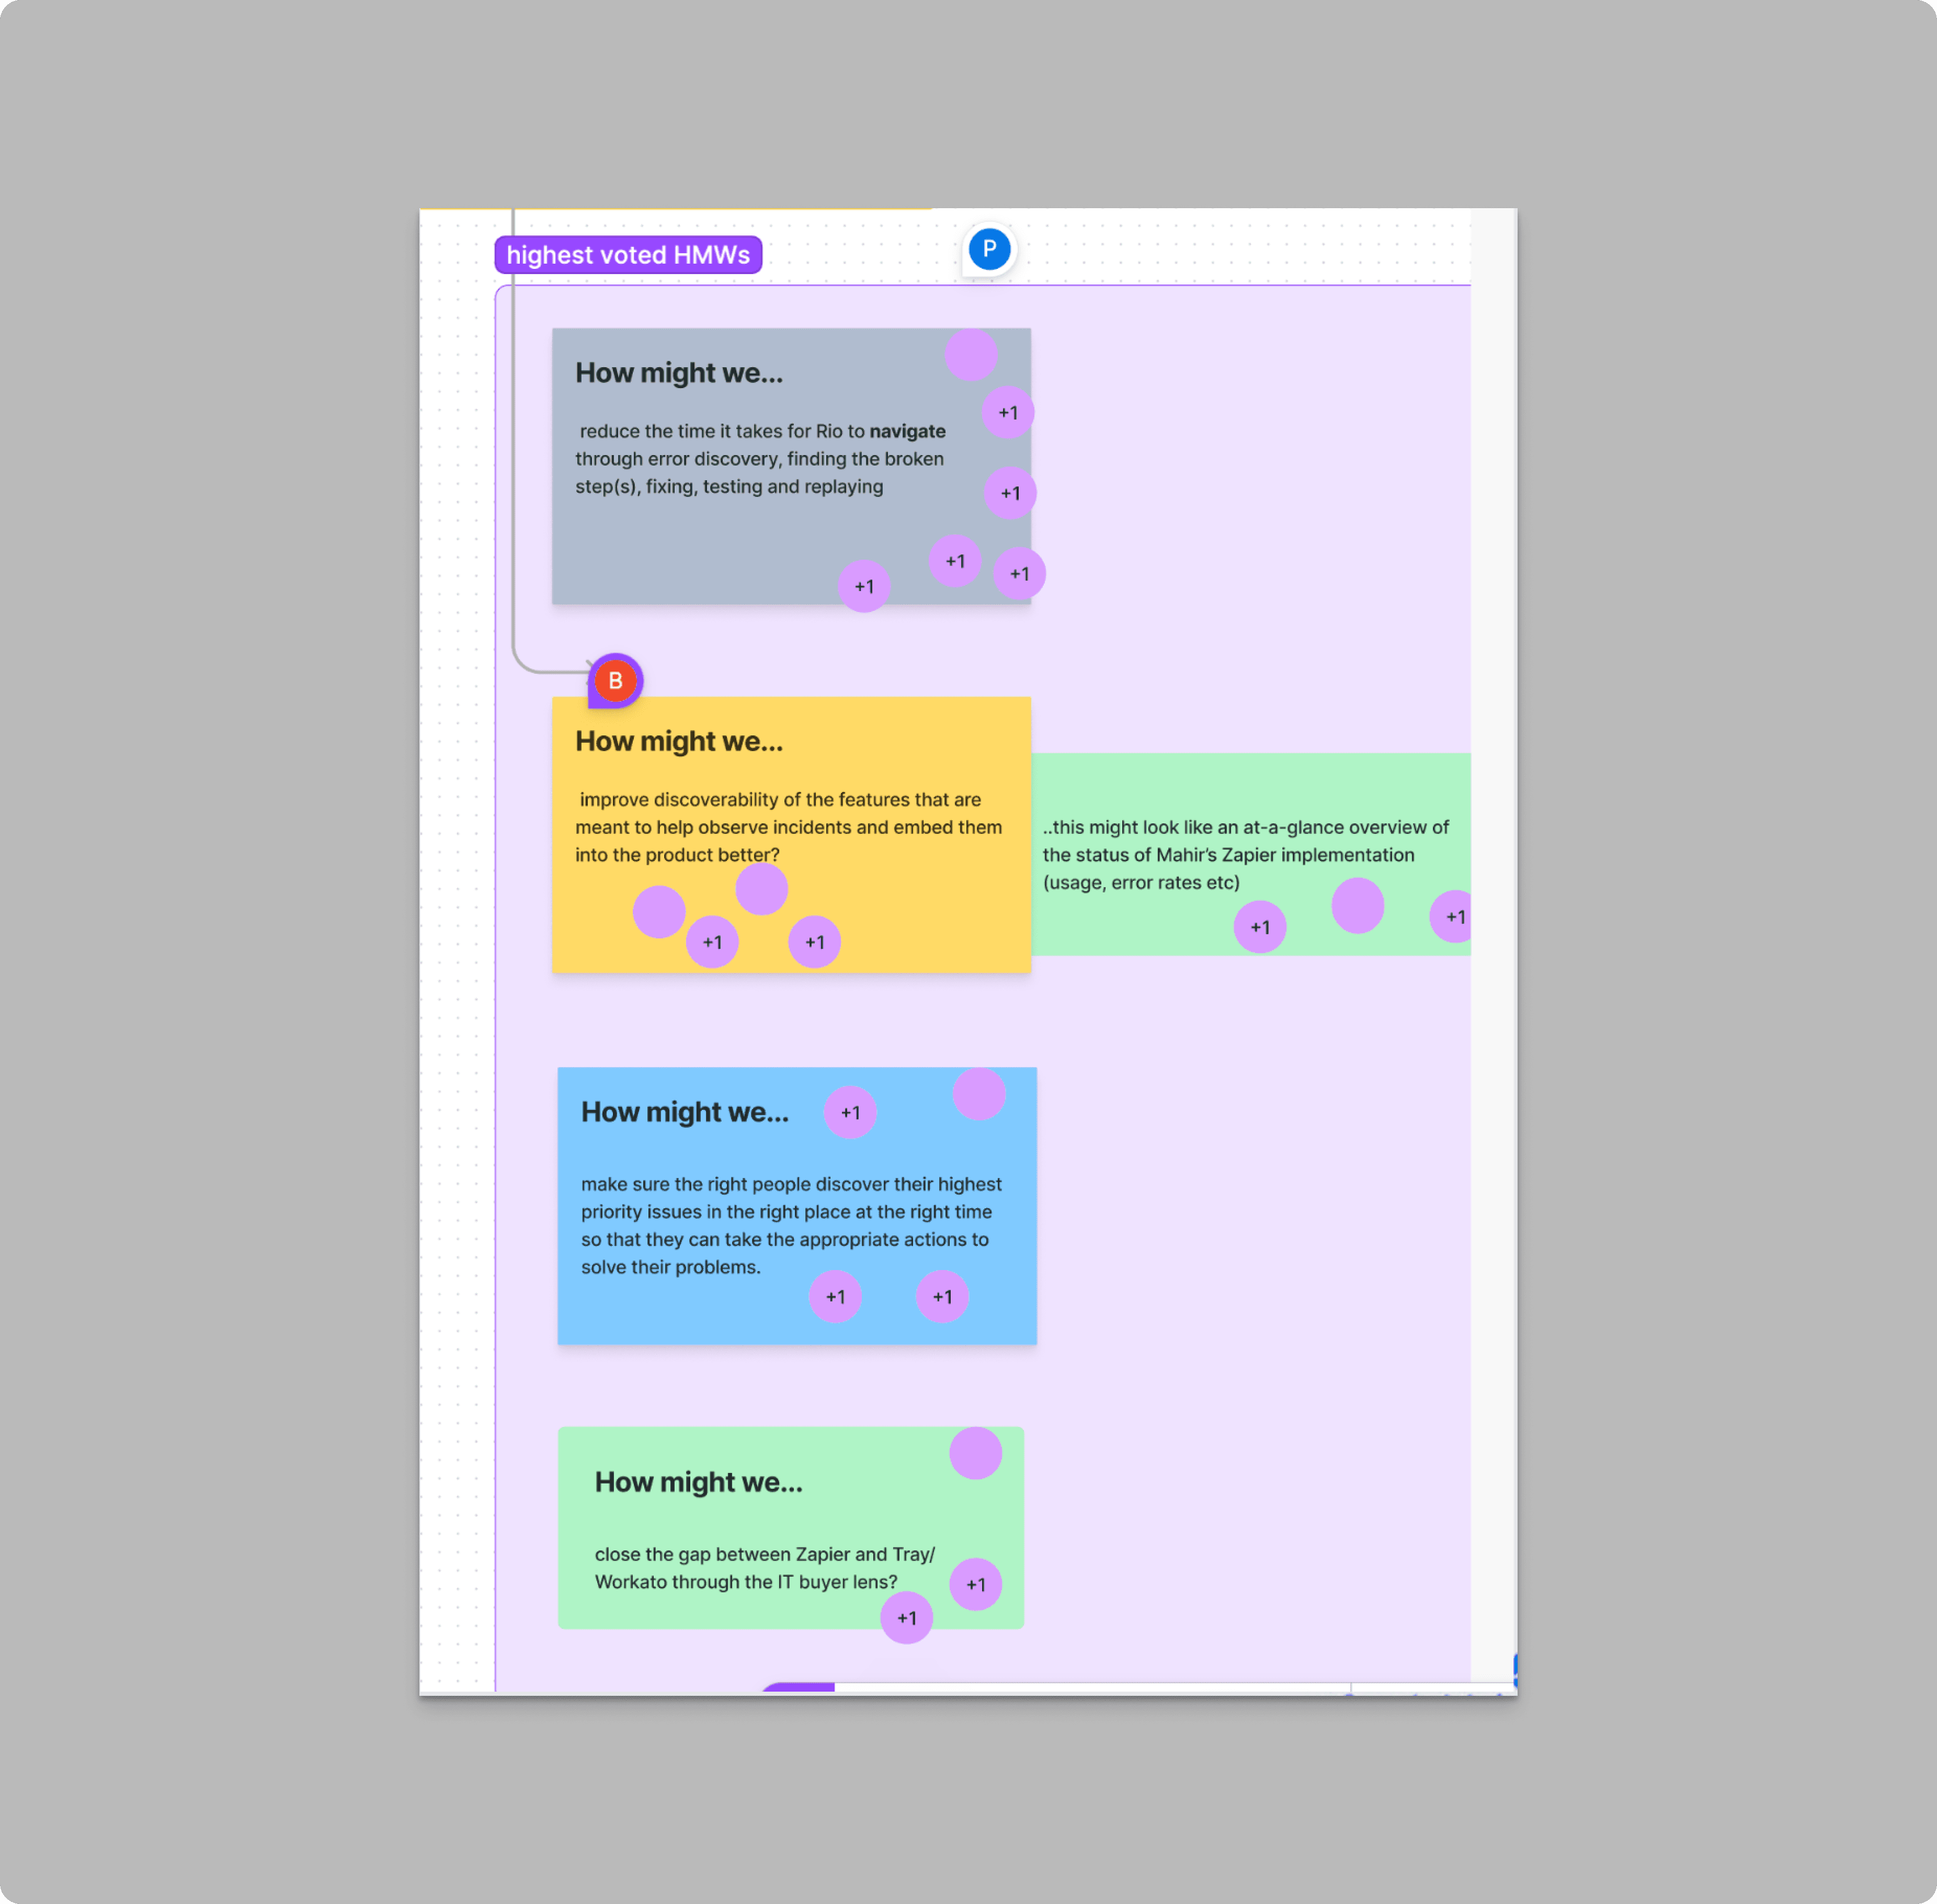
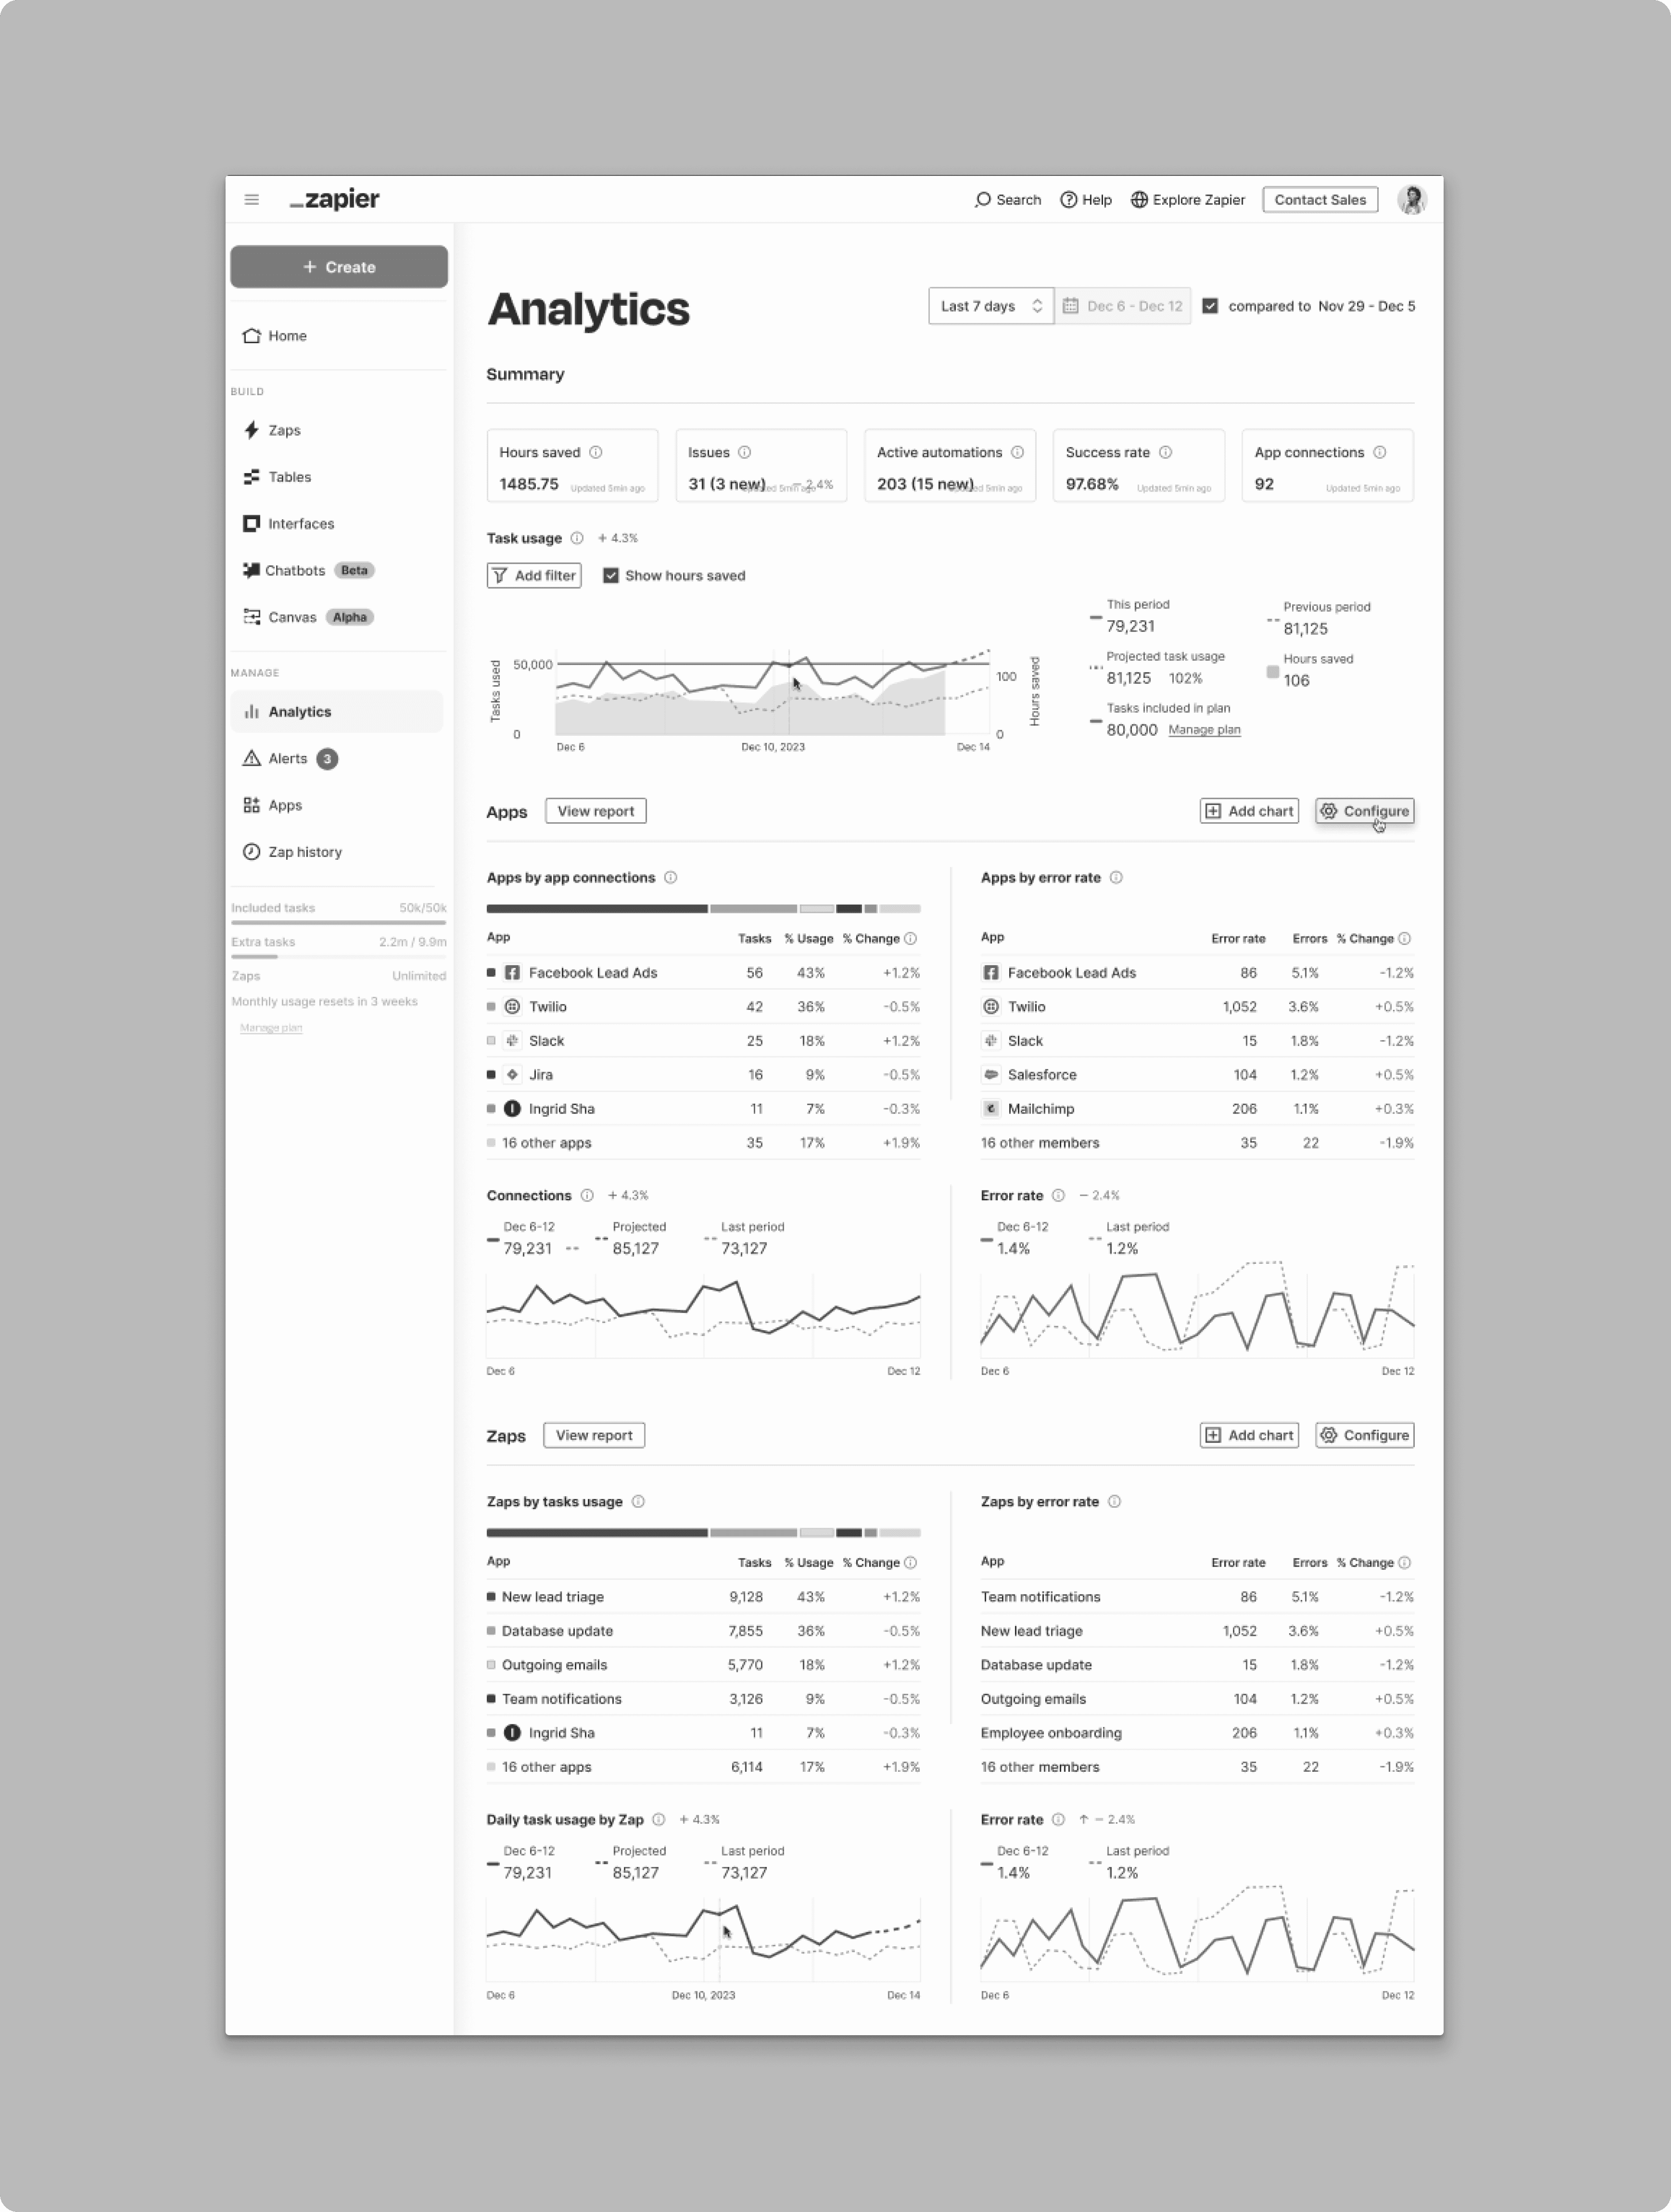

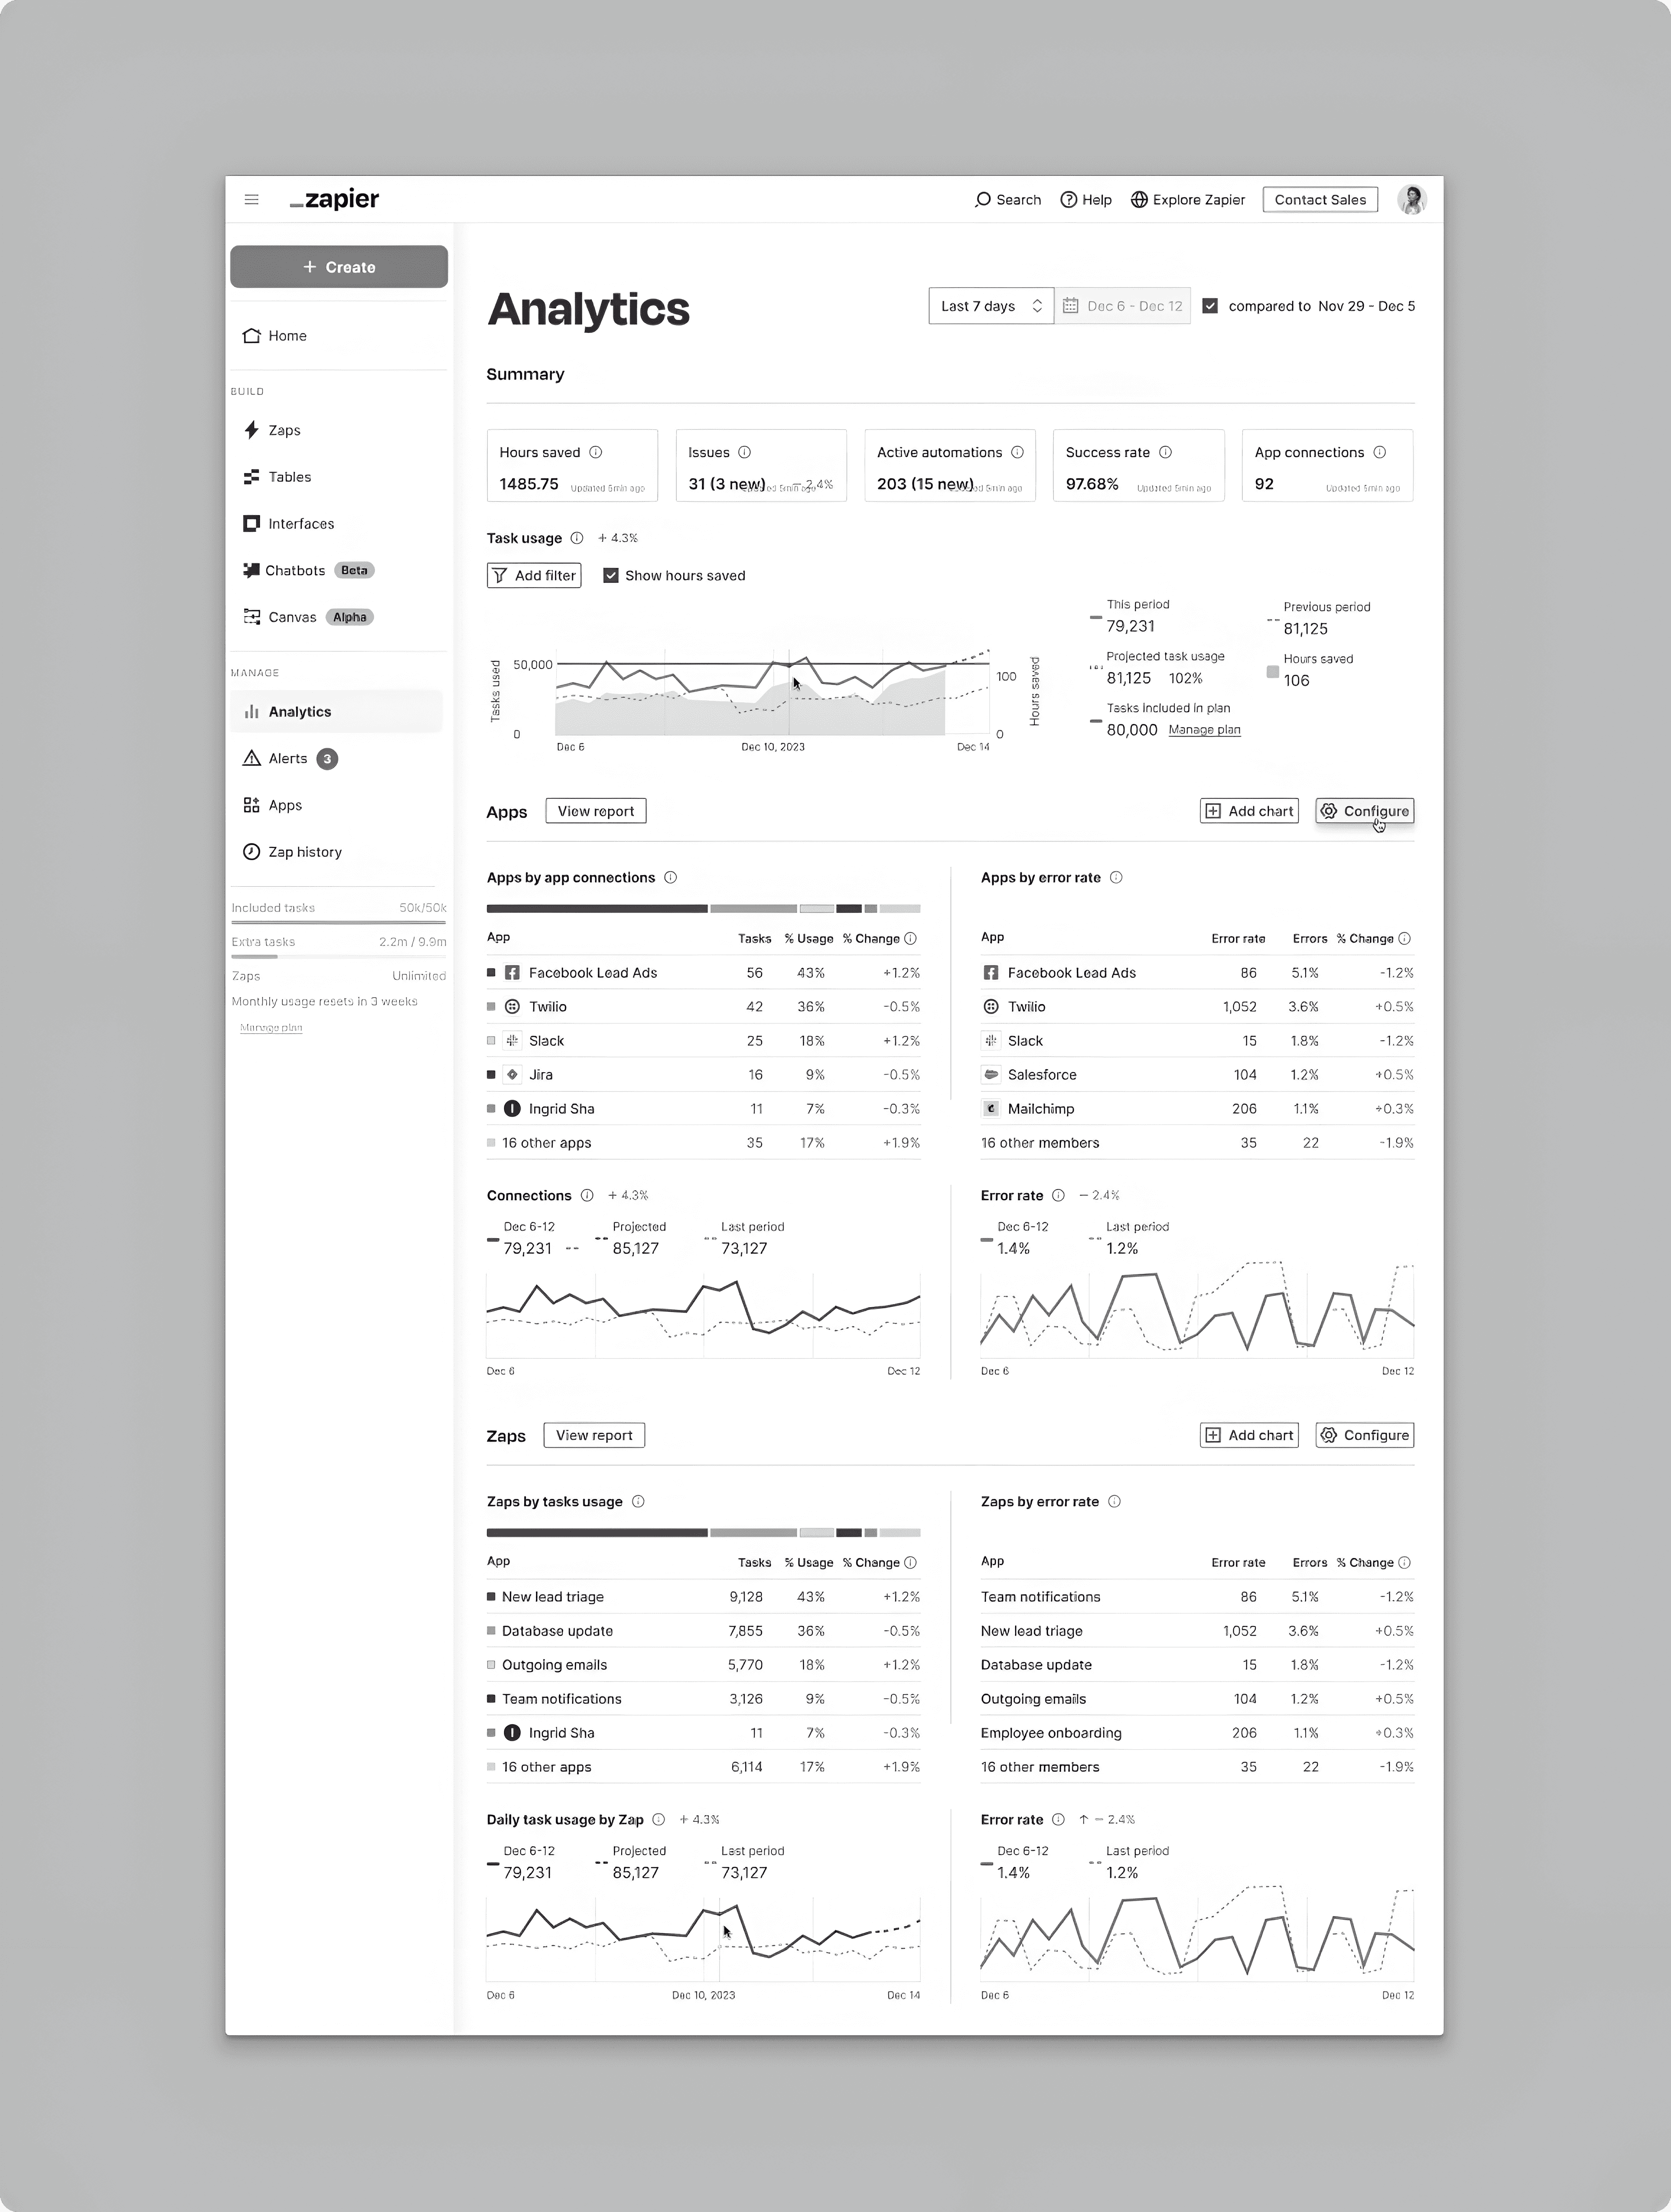

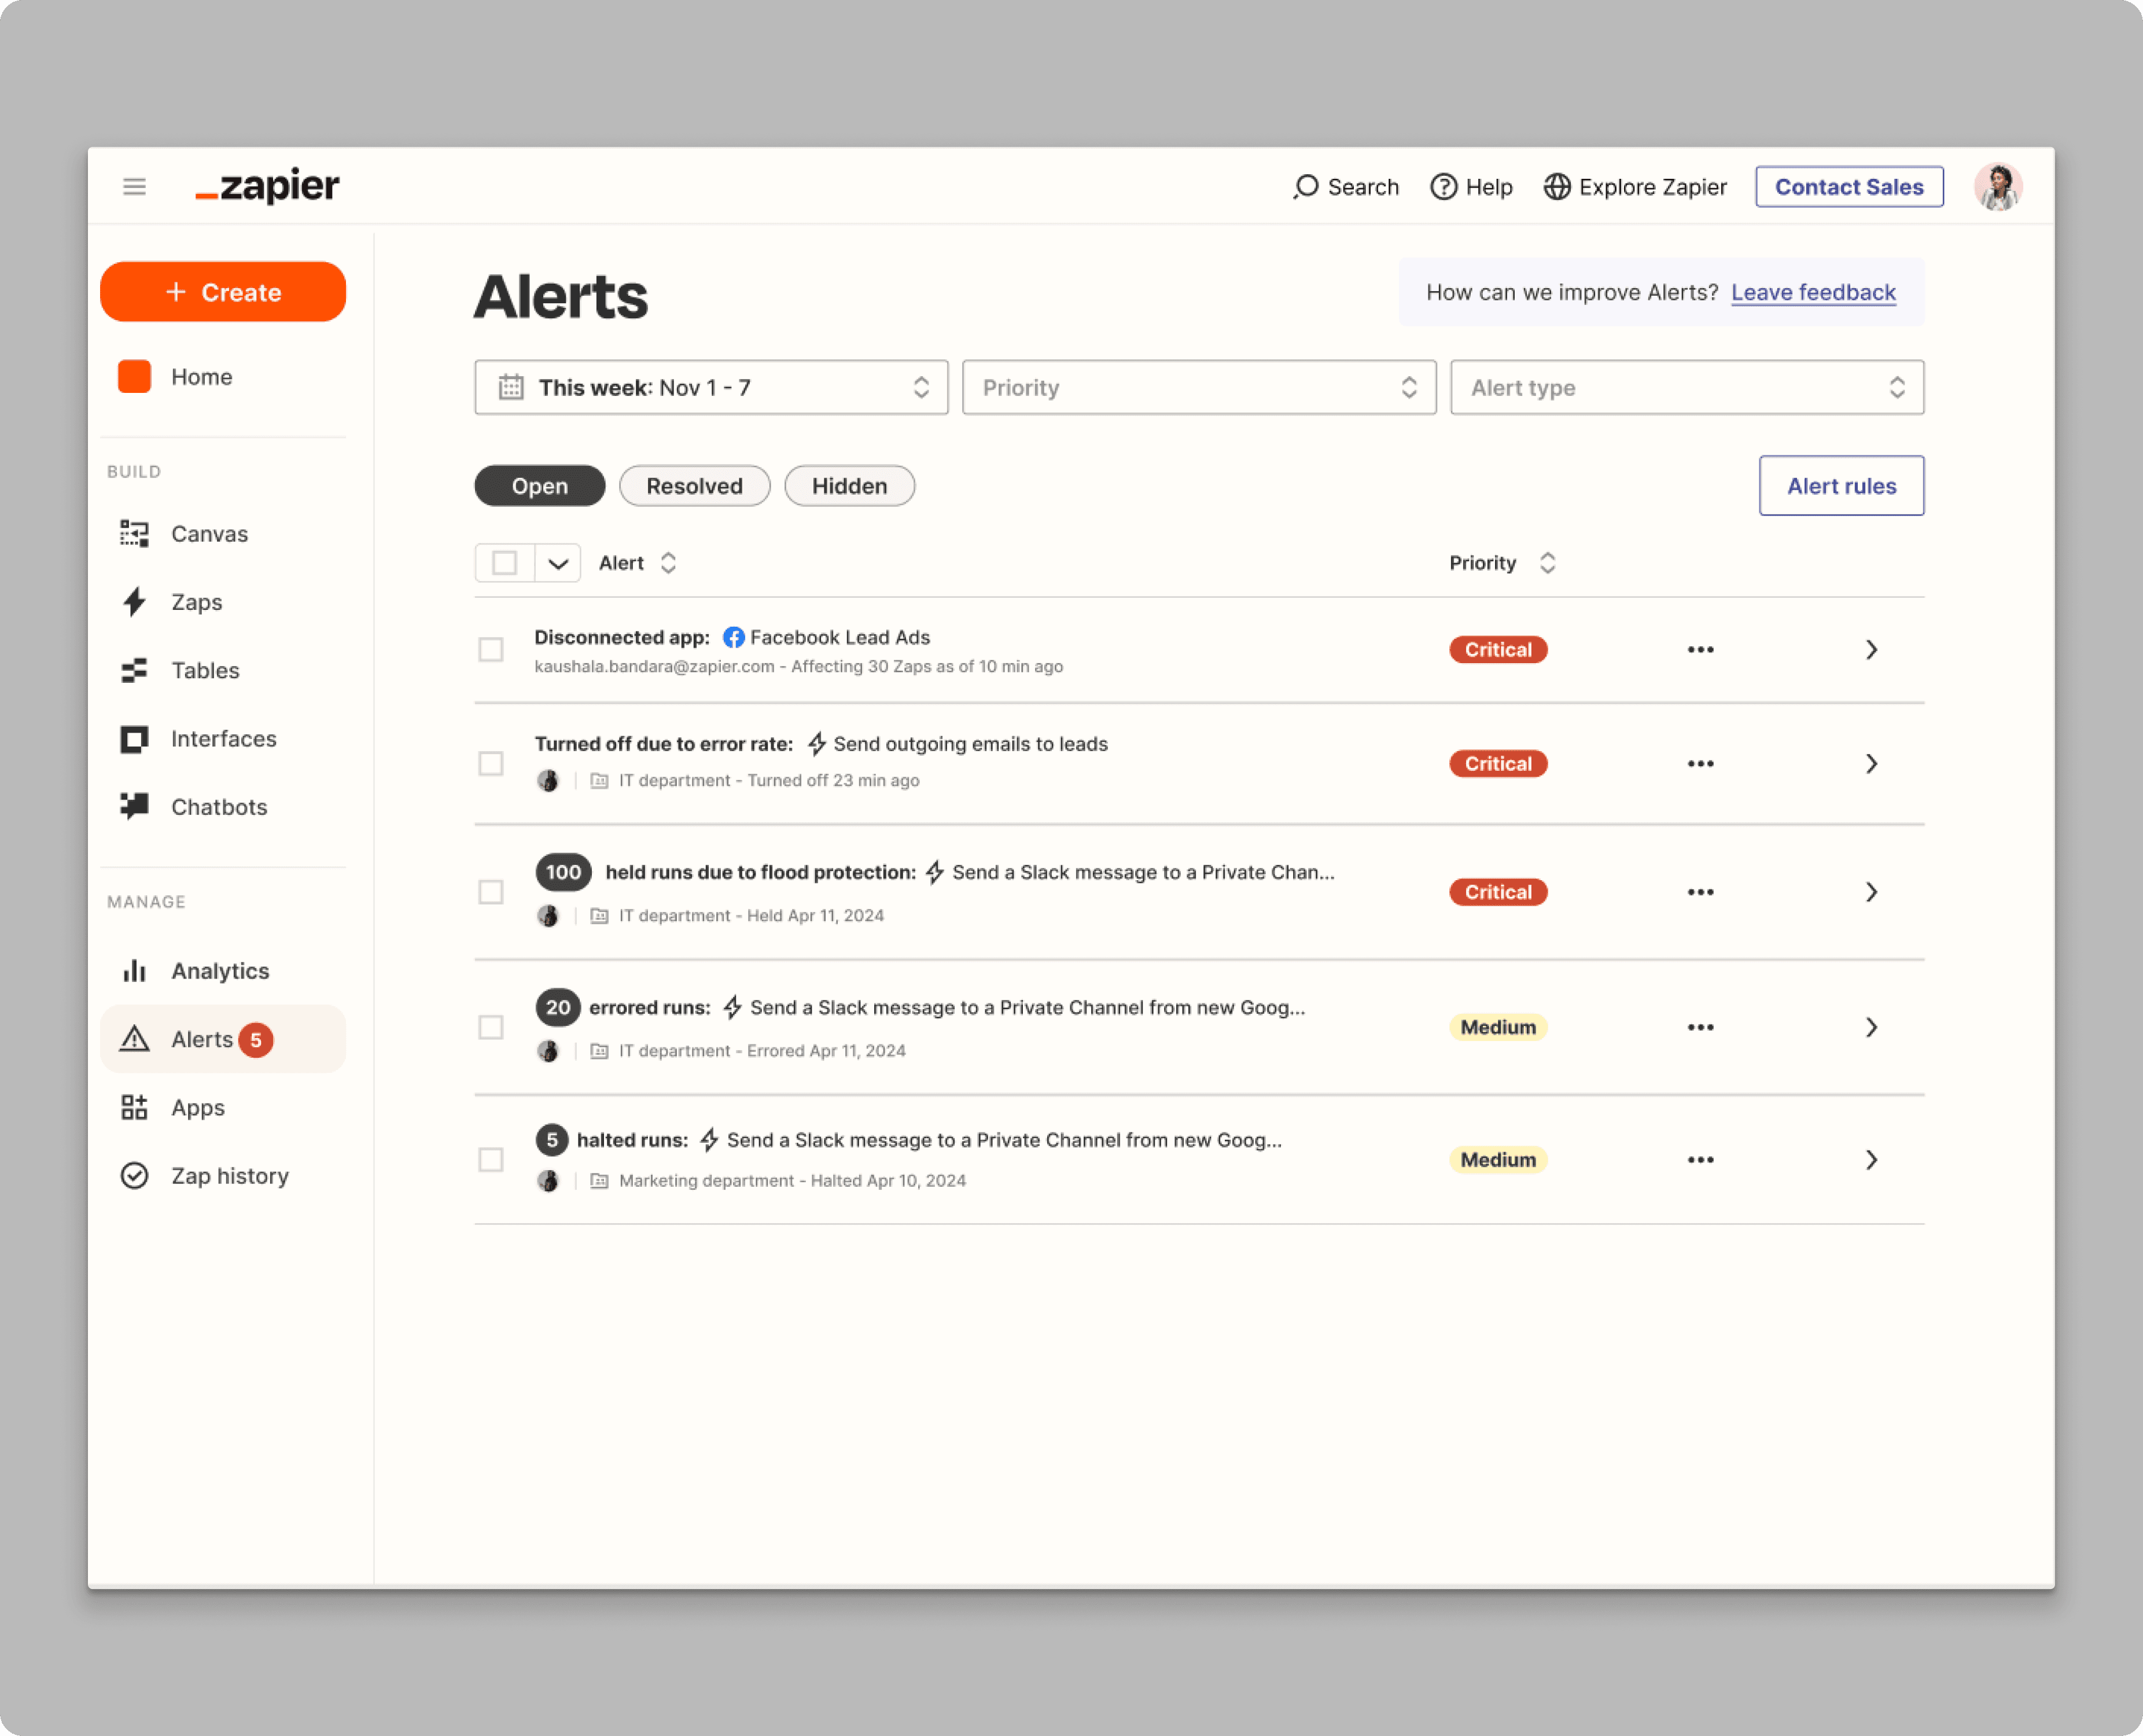
Key Features of the MVP
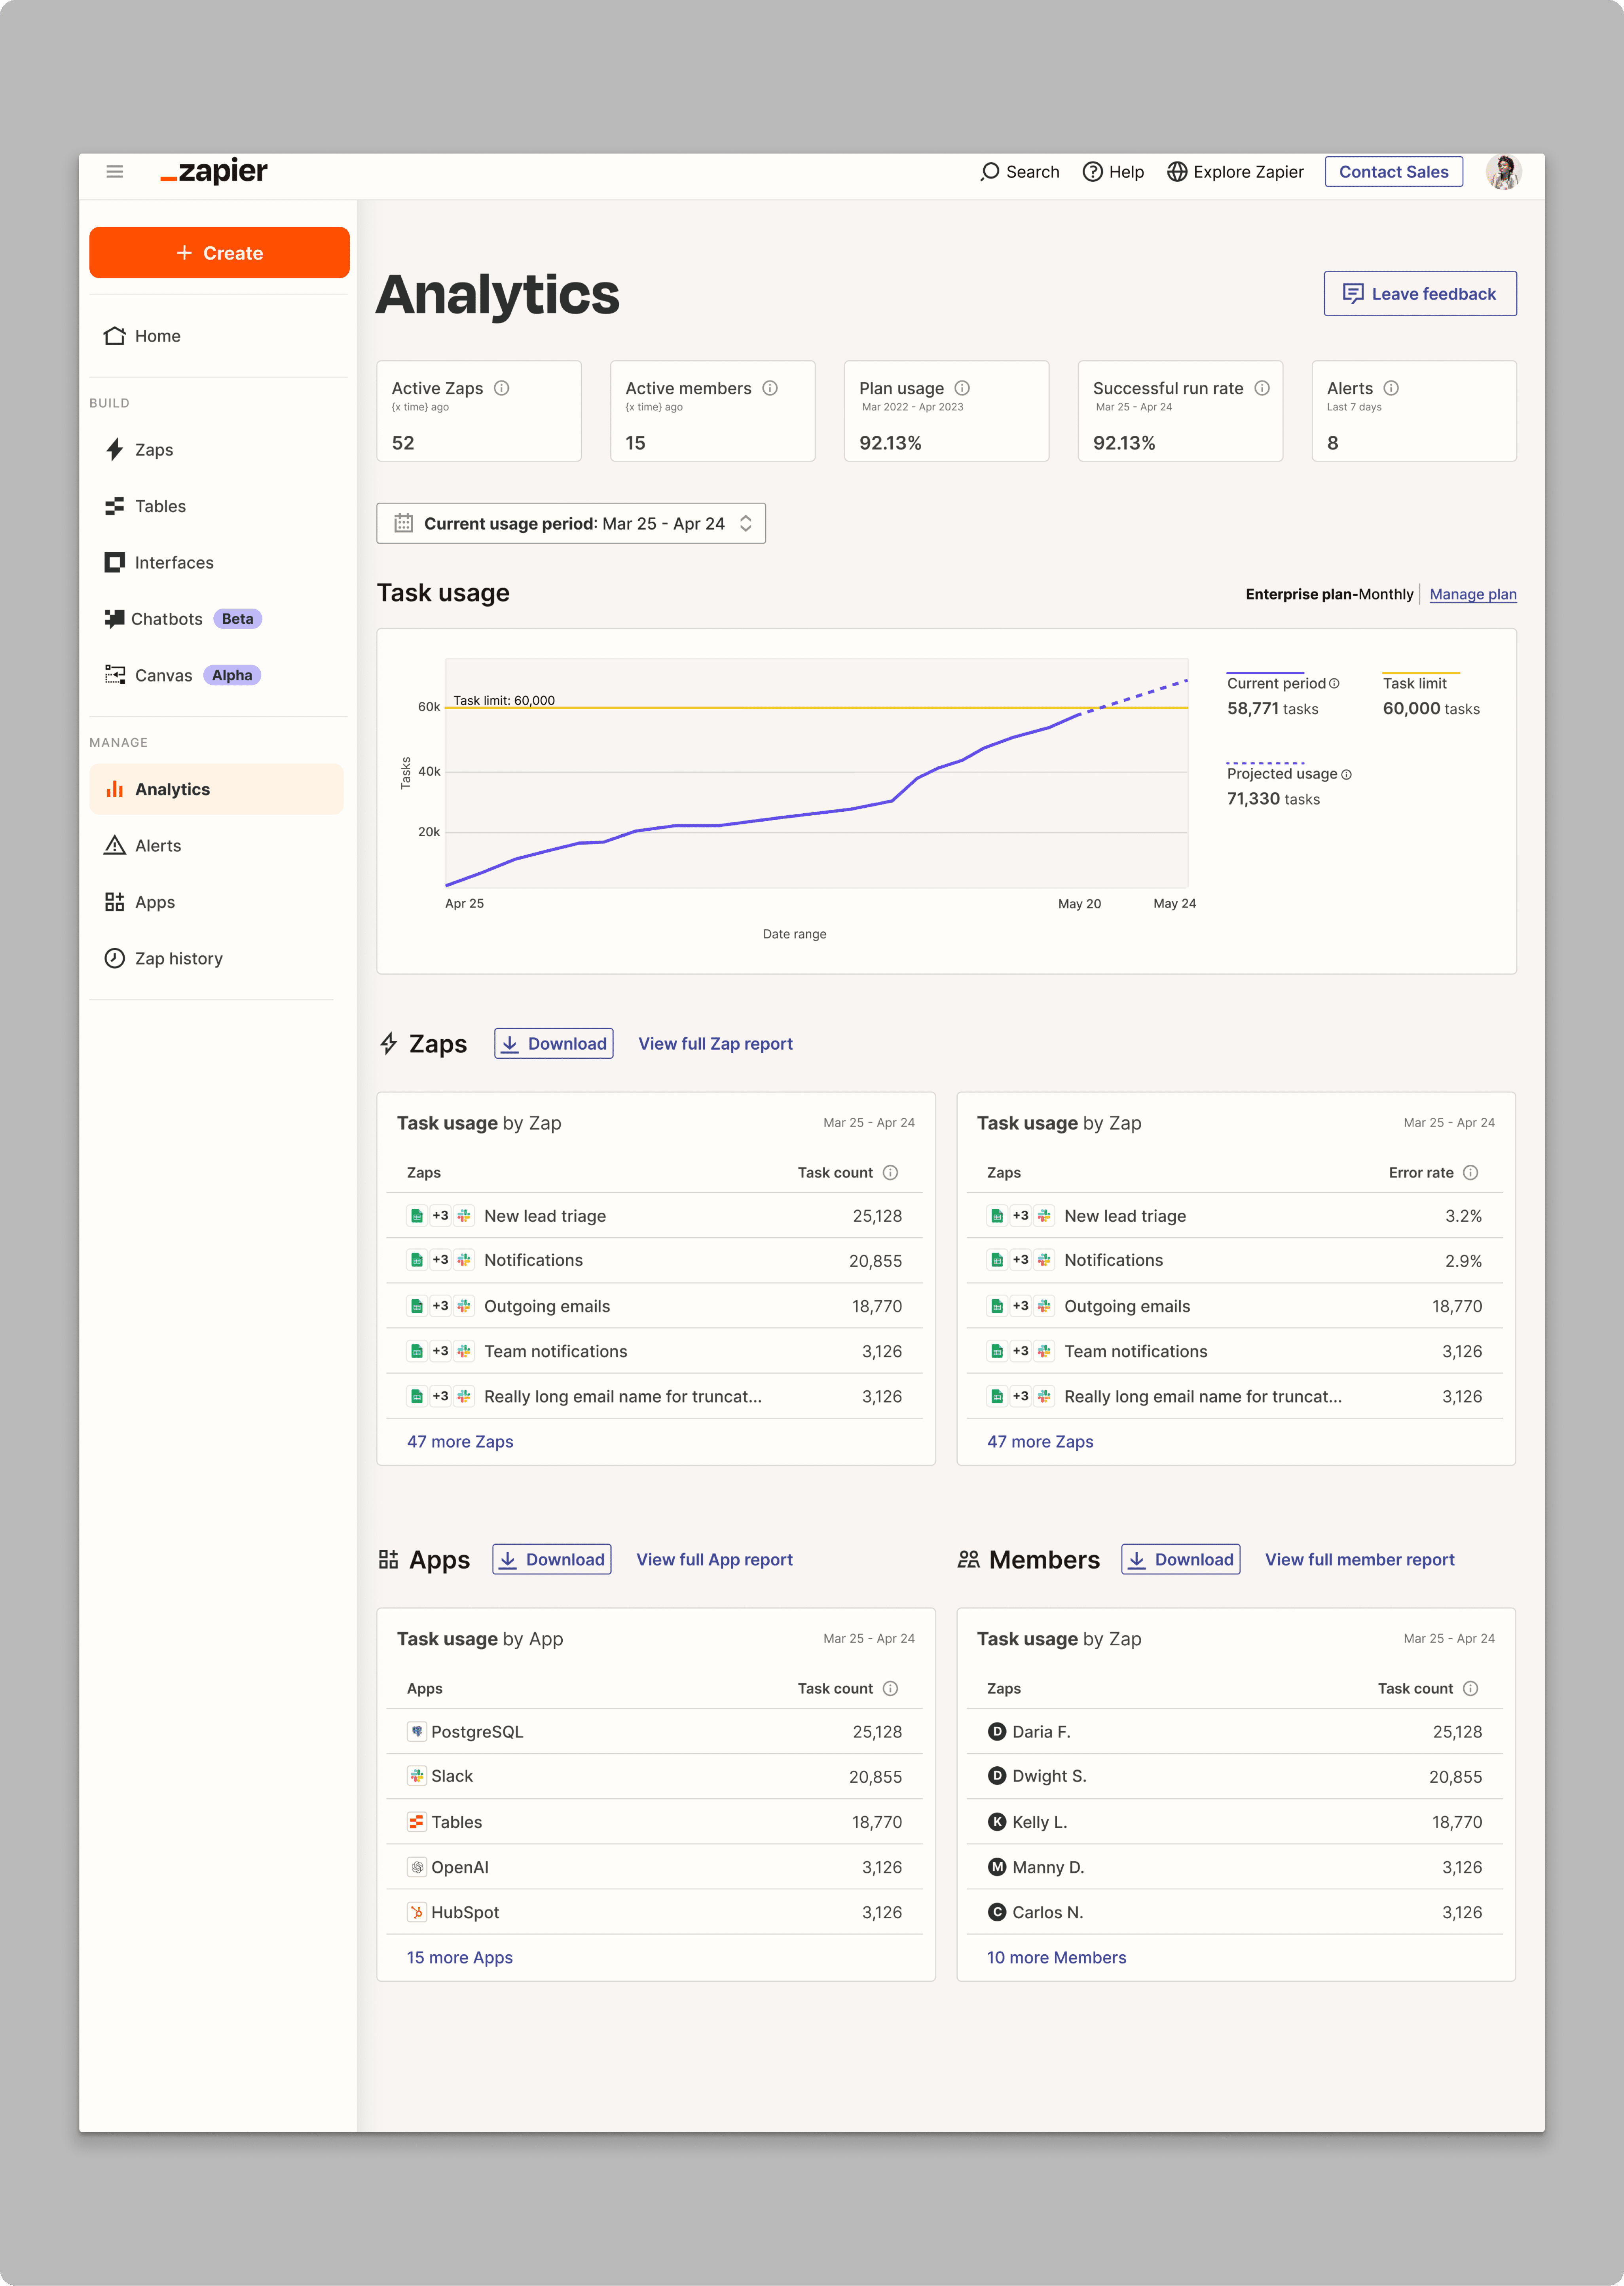
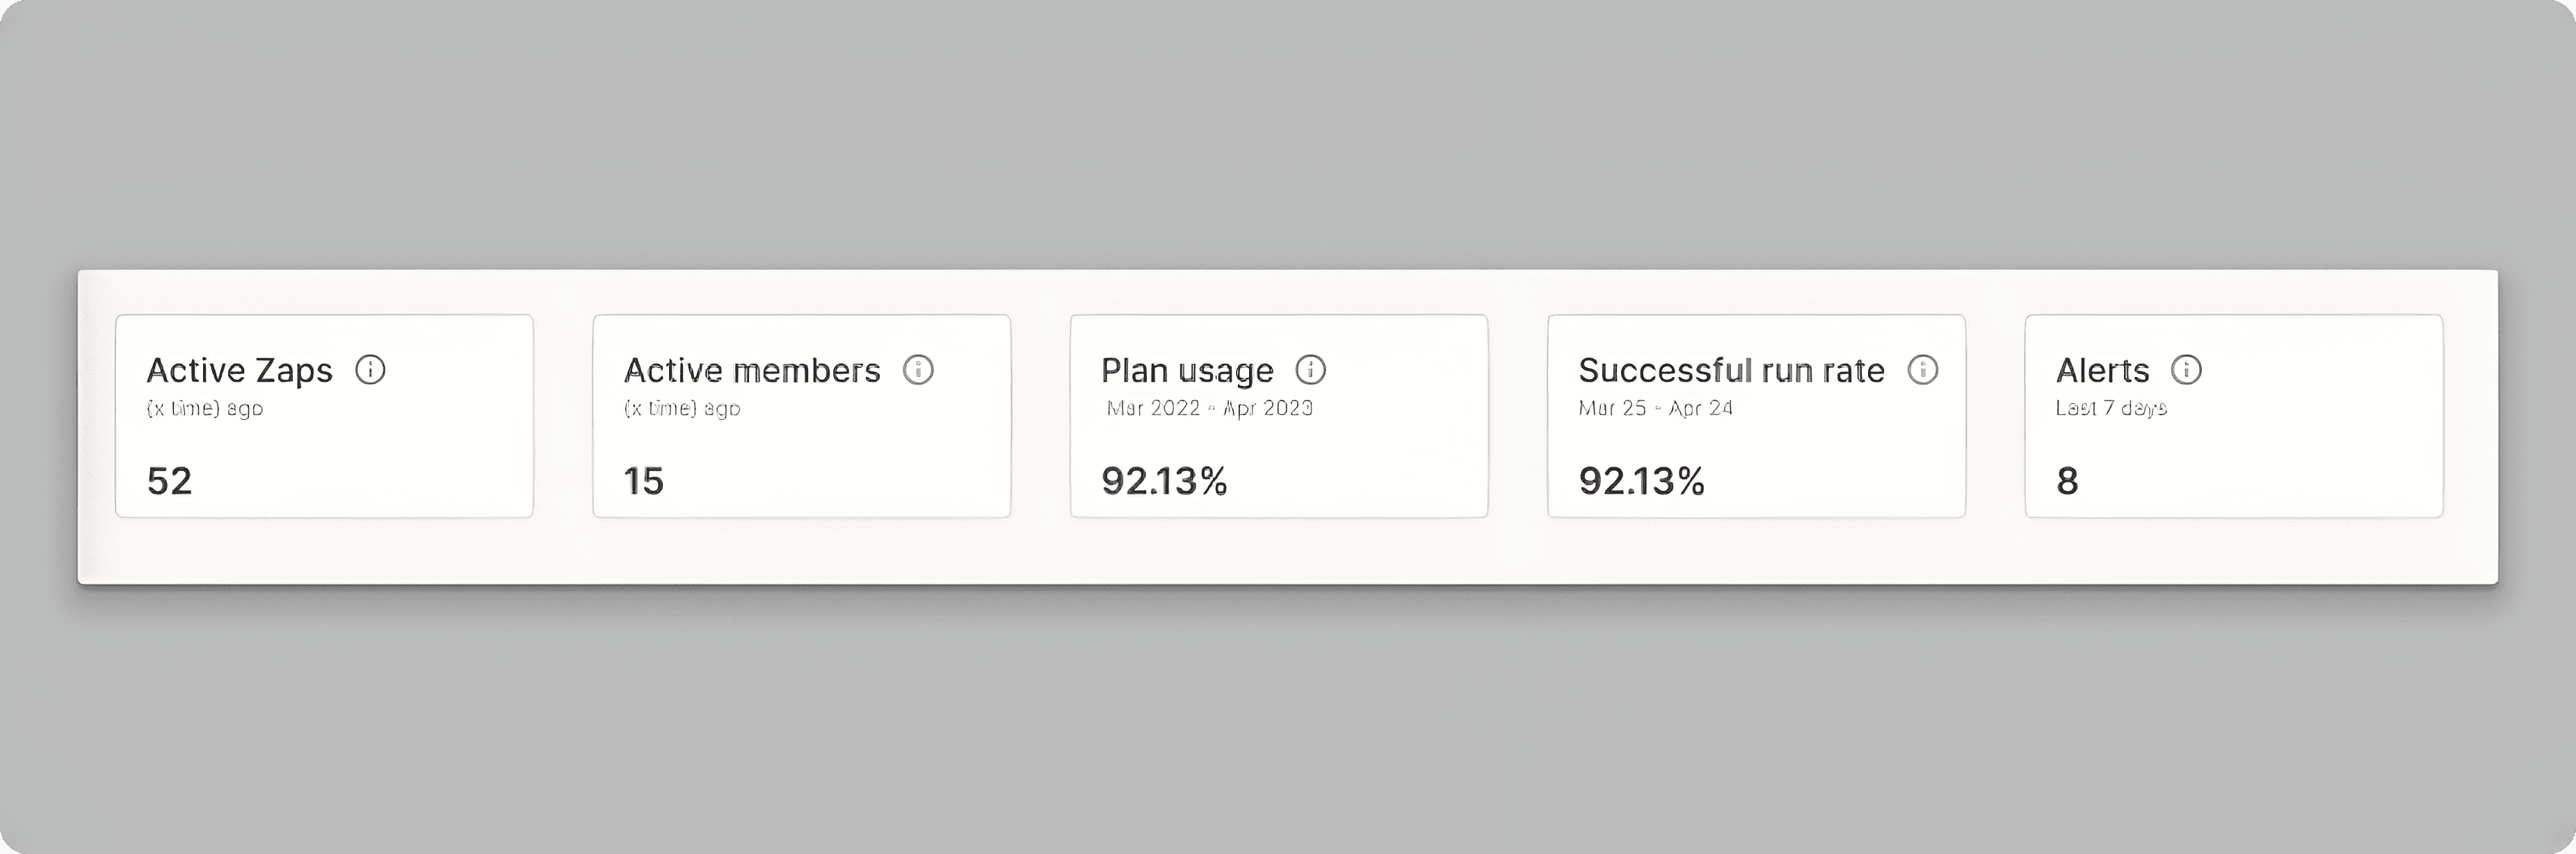
KPI Dashboard
Displays critical metrics, such as active Zaps, active members, plan usage, and error rates.
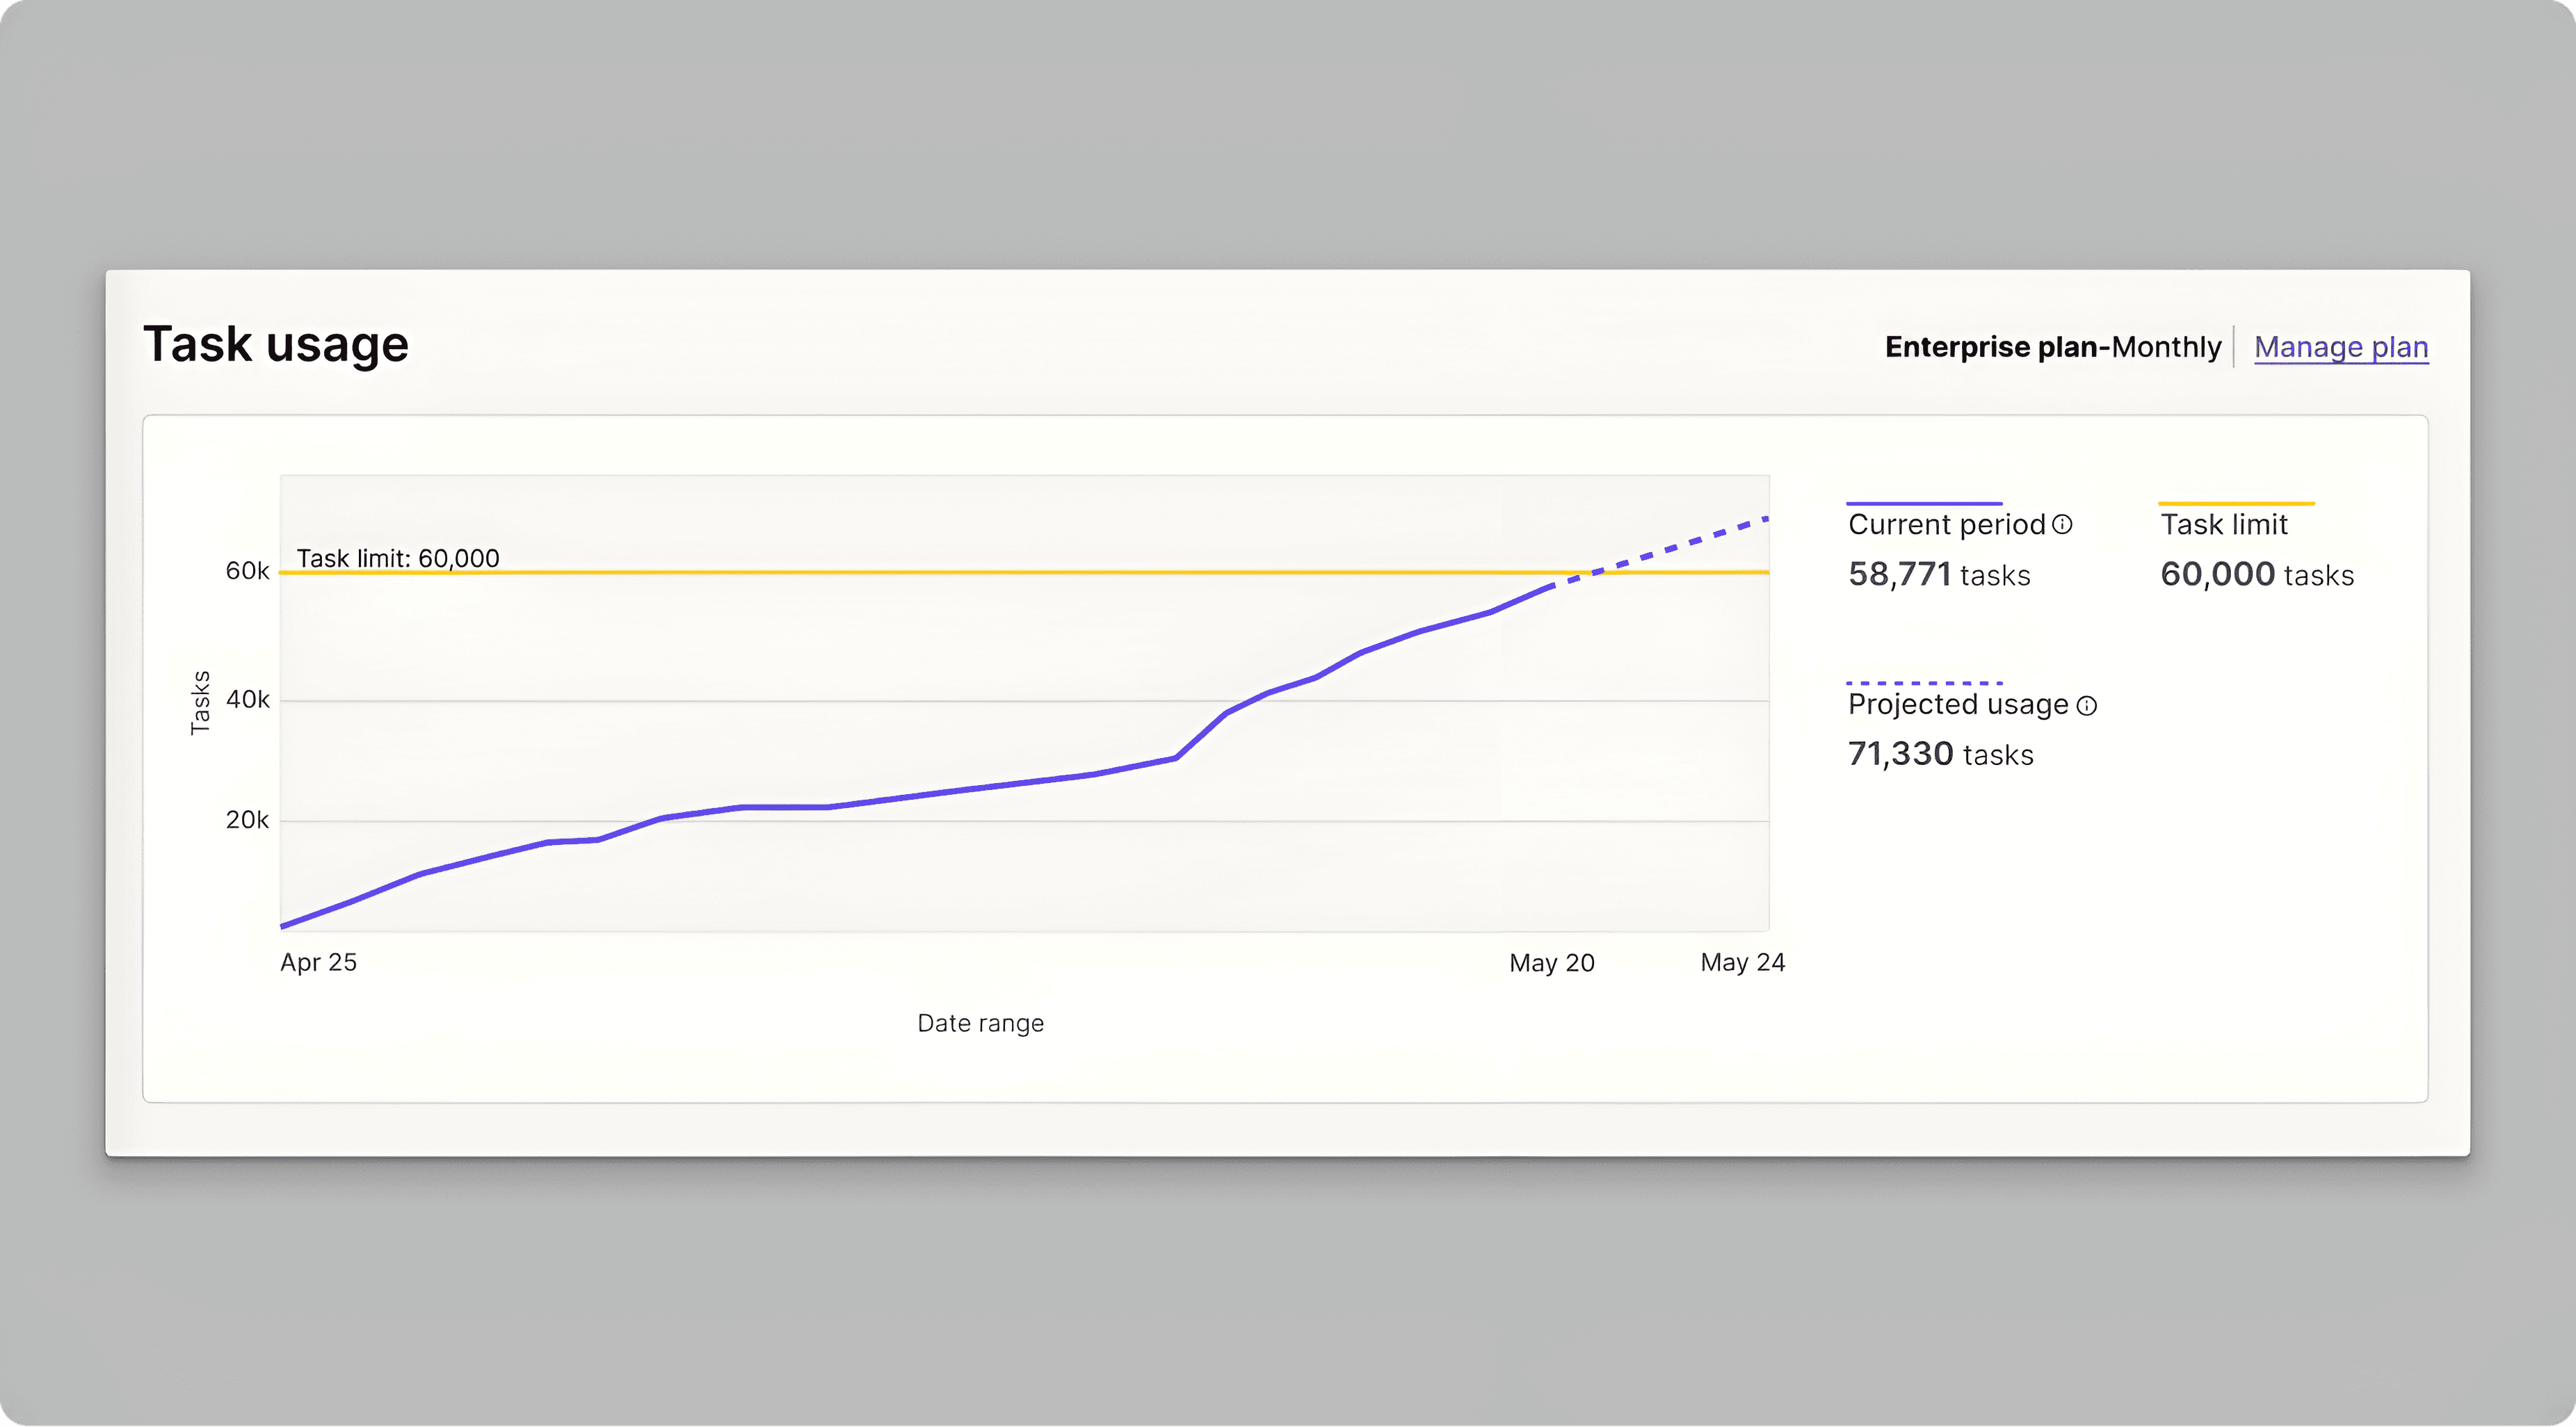
Task Usage Chart
Visualizes task consumption trends over time to aid in resource planning.
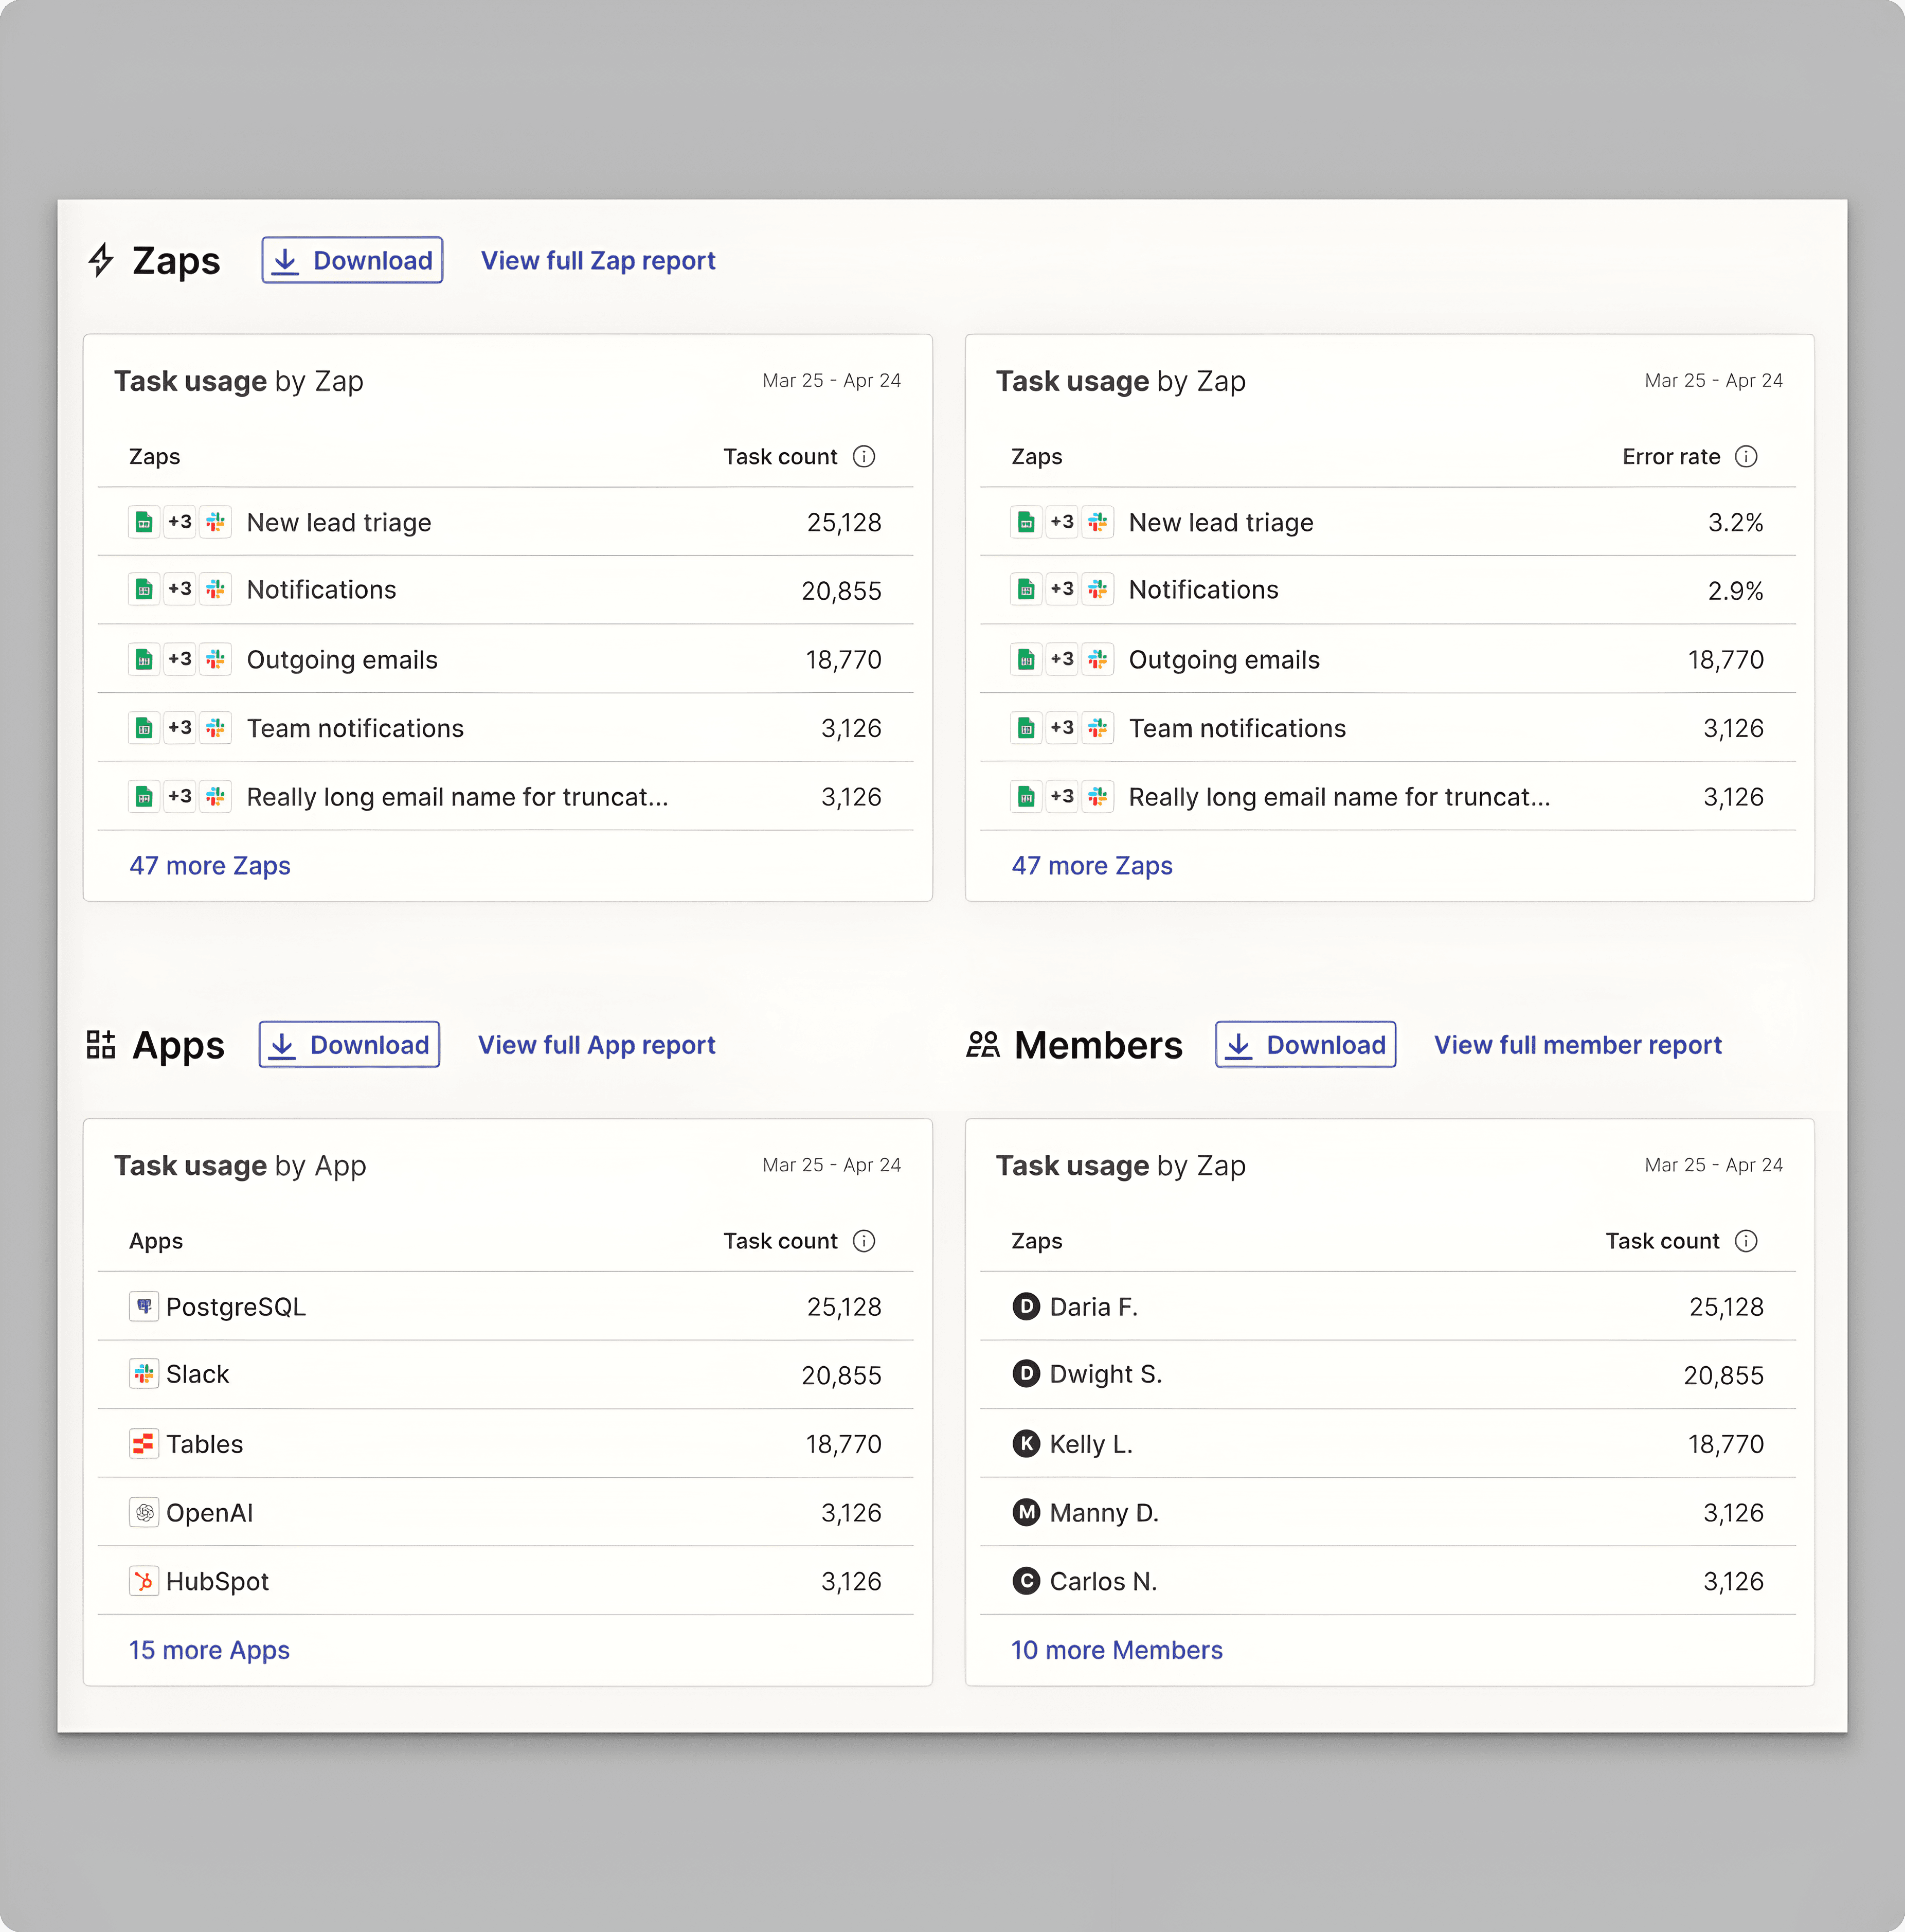
Task Usage and Error Rate Widgets
Provides detailed insights into which Zaps, apps, and users consume the most tasks or encounter frequent errors.
Key Performance Indicators (60 Days Post-Launch)
40% of revenue
The enterprise package’s success contributed to 40% of Zapier’s revenue for the quarter.
56% Retention Rate
Indicated strong engagement, with 56% of enterprise admins returning to use the dashboard after initial exposure.
Post-launch features
Following the MVP release, the team introduced several fast-follow subfeatures to enhance the dashboard:
ROI Tracking
Allowed users to see how much time they saved to affirm workflow automation was worth the investment.

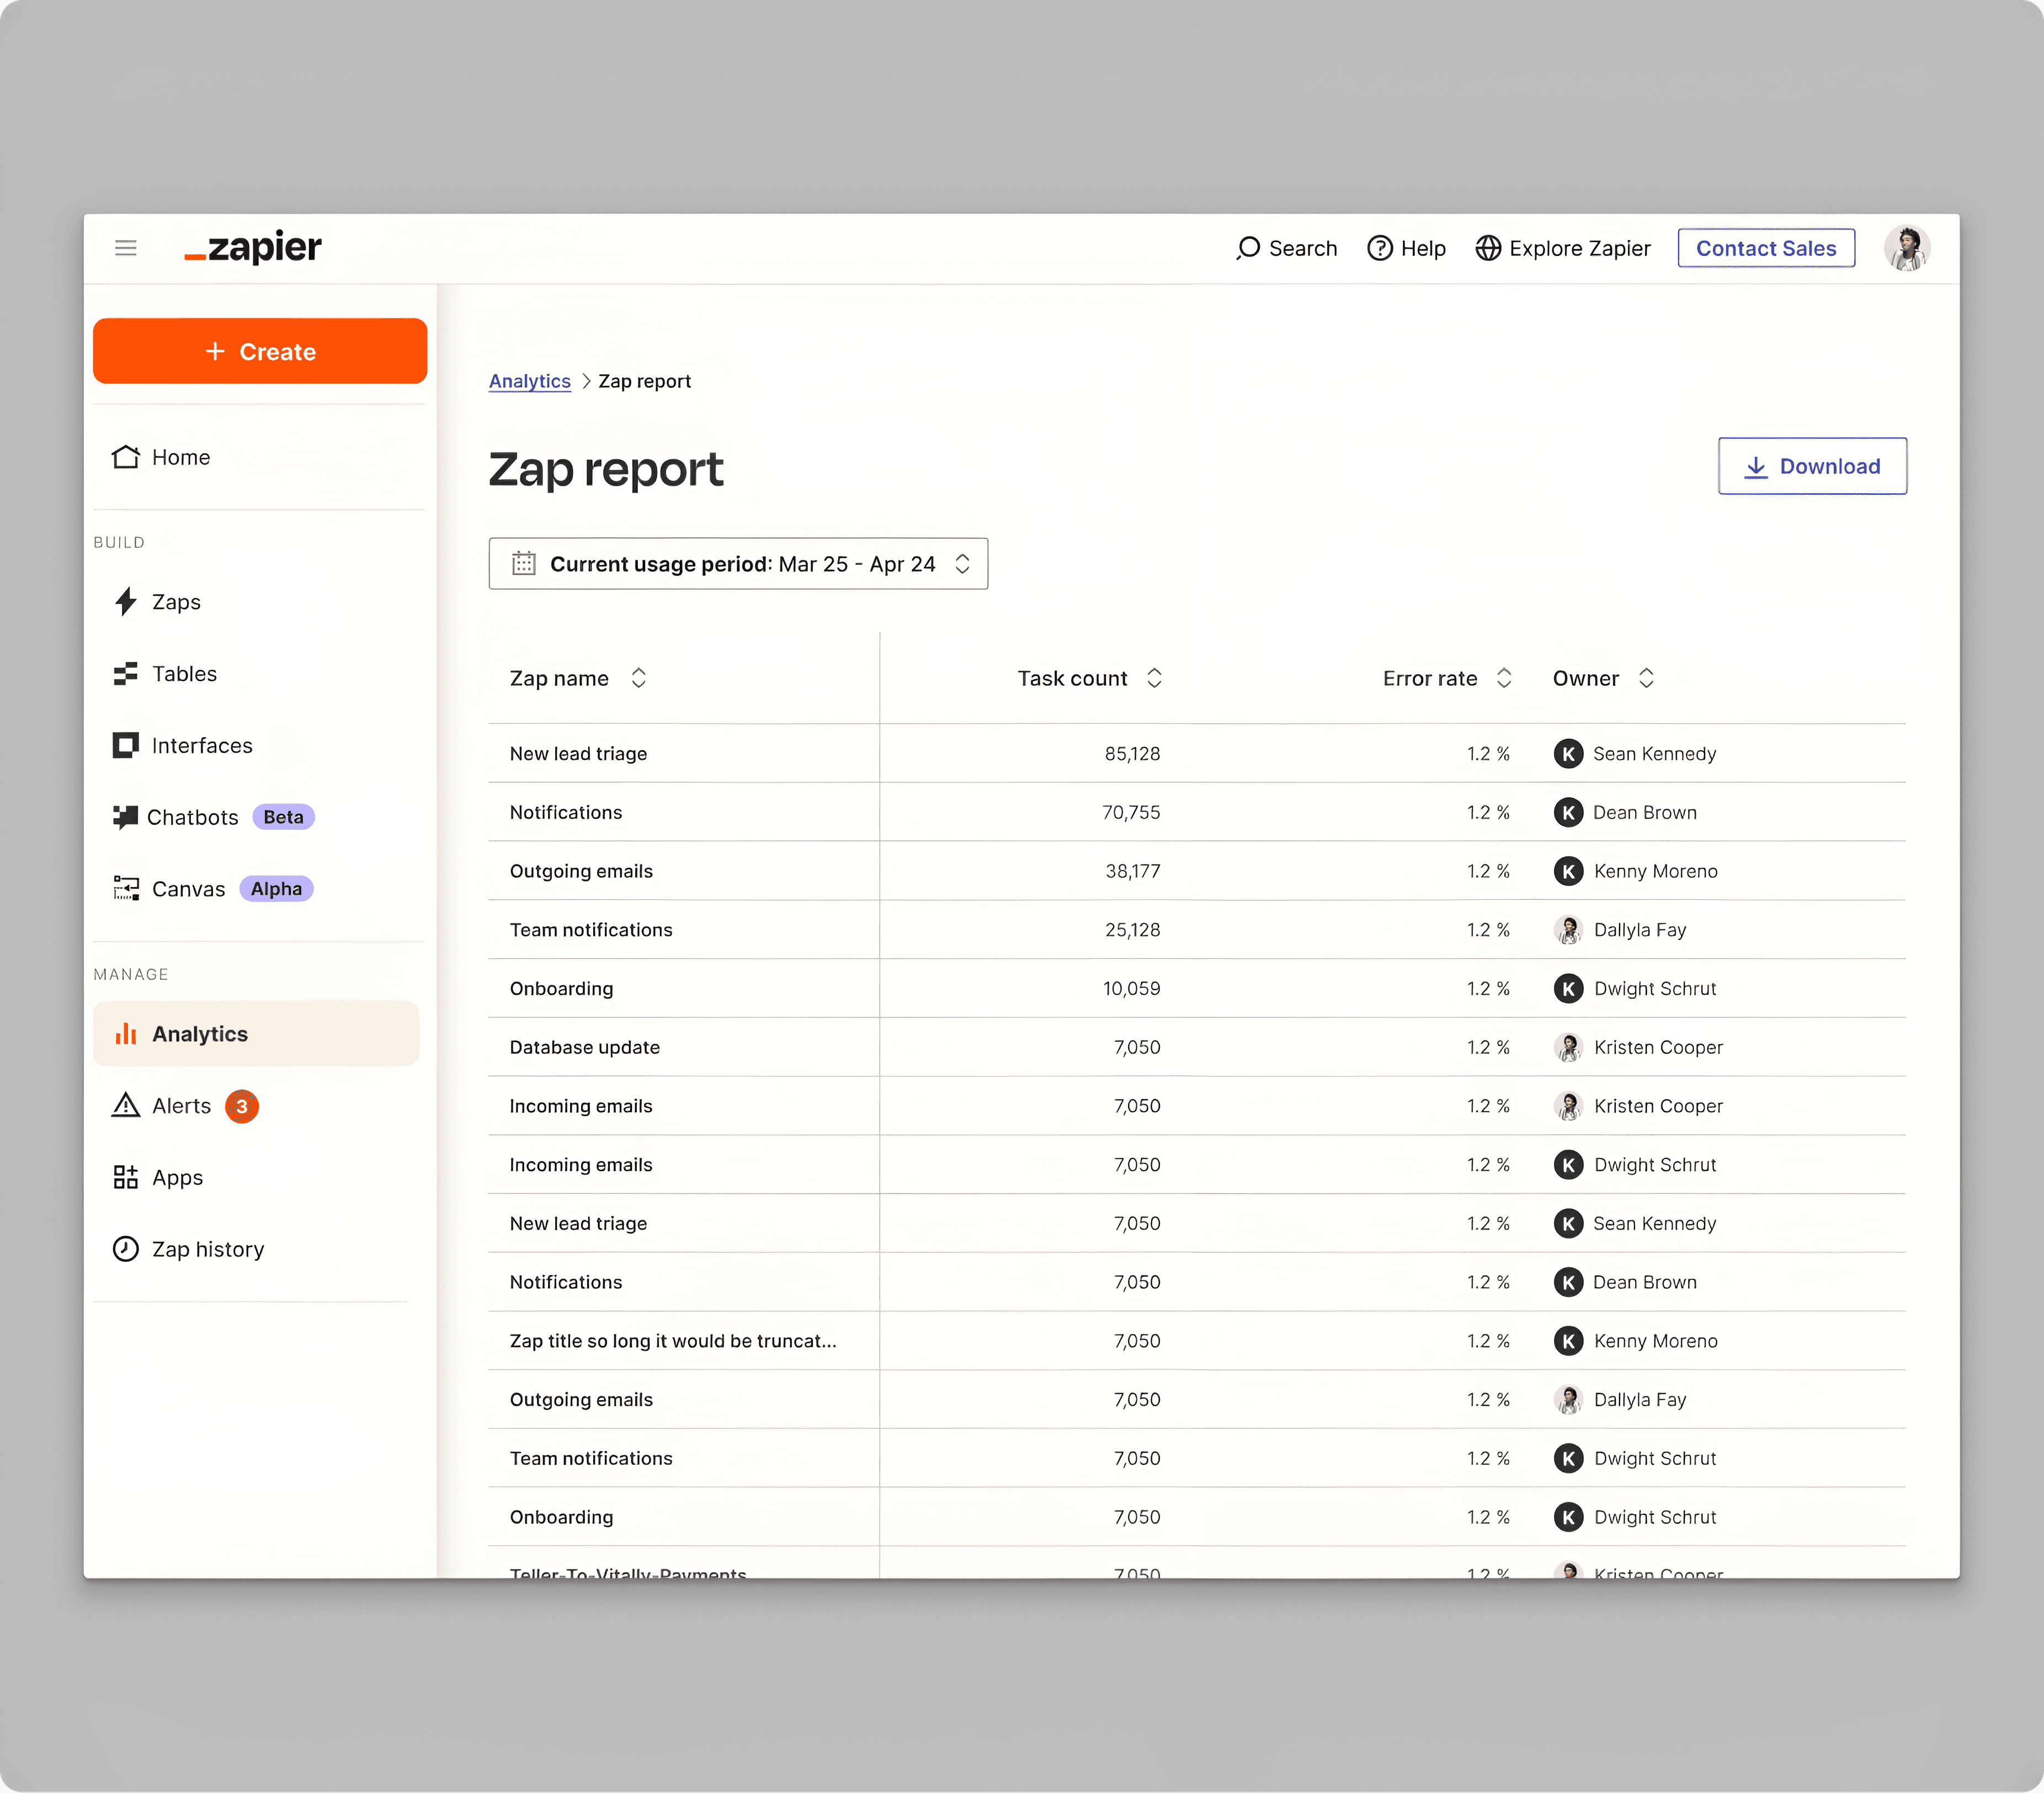
Extended Reports
Enabled users to drill down into widgets and view detailed reports, with the option to download data as CSV files.
Feature considerations:
Expanded data sources
Integrate data at finer levels, including team, folder, and project-level analyticsCustomizable Dashboards
Allow users to tailor their dashboards to surface data most relevant to their workflows.API Integration
Offer API options to seamlessly integrate data into third-party tools, enhancing flexibility for enterprise customers.